

Investors have effortlessly shrugged off the initial sticker shock of an inverted 2s10s Treasury curve (now doing precisely what the mere whiff of last week catalyzed a panic-stricken stampede) with the confidence that’s only born from running a handful of quarterly backtests.
What’s lost in the kerfuffle over signals that may or may not be sent by shape of the Treasury curve is the fact that the front-end is now doing precisely what Fed officials feared the most; and what they are least equipped to handle. Said differently (and I’m being conservative), it’s a trillion dollars at risk – with nobody around to fix it.
Back in May 2019, several decades ago by the collective market memory, Lael Brainard gave an important speech as part of the “Fed Listens” series. In it, she laid down some key concerns that came with the normalization of policy – and she noted the ways in which the Fed could potentially respond, including “yield curve control”, associated most notably with the Bank of Japan’s (most recent/failed) experiment to mobilize stubbornly low inflation. It’s clear from her speech that while she can picture a world in which that might become necessary, it’s one she hopes is a long way off. Rightly so: a broken yield curve where the front-end drifts without any kind of policy anchor is something that routinely shows up in central bankers’ nightmares.
https://www.federalreserve.gov/newsevents/speech/brainard20190508a.htm

Made in Japan
Fast forward 3 months: the very thing that Brainard suggested as a last-ditch policy – and which, by the way, at the time was dismissed roundly by the market for the very reason that it had been proven so inept by the Bank of Japan in actually raising inflation – will very likely become reality[1]. Its exigence is now on display in the front-end of the Treasury curve, which is not all right. Not by any stretch.
Here’s a long-term historical chart of 2yr spreads (matched-maturity ASW to be precise). As you can see we’re at the absolute lowest level in the last 20 years. Far from implying that Treasuries have gotten richer on swap, this actually highlights the opposite. 2yr Treasuries are at their cheapest levels in a generation. This is exactly what the Fed laid out as their “worst case” scenario.

Now, there are a lot of reasons why Treasuries can cheapen locally on ASW – but most of them don’t appear to be in play right now. In fact, if anything we’re seeing the opposite in a lot of cases. The issuance calendar is fairly light. Equities are choppy. Foreign demand is fine, for the moment. Dealer balance sheet is no longer the pressing issue it was 6 months ago (particularly in the 2yr point).

So… what gives?
Here’s a hint.

This chart shows the intraday range for the 2yr Treasury (20d mavg), an asset which has traditionally been viewed as the ultimate in safe haven investments for the risk-averse. We’ve had double-digit moves in nearly half the days in August.
For an investor who bought Treasuries looking for a way to reduce risk – they’re clearly not doing that. Meanwhile, we’ve seen an eye-popping 100bp+ rally in the past 6 months. Investors piled in last year when they averaged barely 2bps range in a day, clutching onto a safe haven vehicle as a way to diversify an otherwise risky portfolio. The moves alone have caused the vast majority who look at investments on a risk-adjusted basis to opt for another port in the storm.
In the largest ETFs, the flow this year has been reminiscent of a tidal wave.

The Danger to Other Asset Classes
It’s easy to forget how large these moves are since they’re (typically) confined to one part of the Treasury curve. When they spillover into other assets is when a serious problem turns catastrophic.
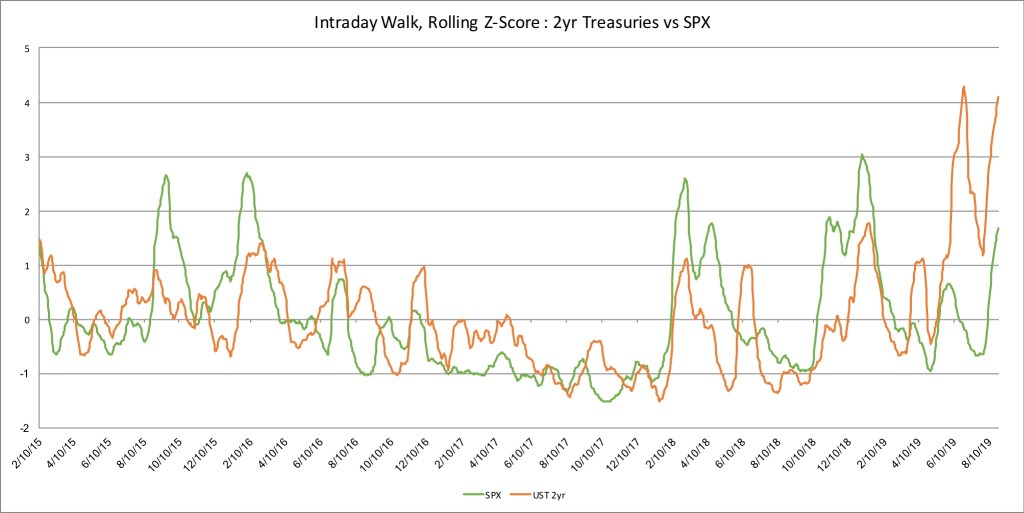
To put it another way, if you were to extrapolate the realized moves in 2yr Treasuries onto the S&P, that would mean the equity market (ES1) should AVERAGE a little under 100 point ranges… every day for the last month!
Generally speaking, the 2yr note isn’t supposed to see average daily moves that are the same as what’s witnessed in equity markets. It definitely isn’t supposed to see a move that’s more than 2x in realized volatility terms.
Indeed, the realized moves in Treasury space are well above what’s implied in swaption-land. The typical 2yr note trader isn’t used to having to think about daily breakevens – but now that’s much more a concern for them than your street exotics desk.

This is painfully obvious in the hedging that goes on intraday. If we look at each hour of the day over the past 3 months & strip out the event weights (i.e. control for things like payrolls, CPI, FOMC meetings etc), we can see that there are only a few hours of the day that see an outsized influence from delta hedging. That’s (perhaps unsurprisingly) around the European close & the US close.

The Root of the Problem
Obviously, it wasn’t always this way. We have the Fed to thank for this.
Consider rolling weekly returns from owning 2yr notes this year versus the prior 19. A few things should be apparent.
1) The red histogram is tilted further to the right (i.e. the “skewness” is less negative).
2) The size of the tails appears larger (particularly on the right side, i.e. the “kurtosis” is larger).

Moreover, the absolute daily returns also appear very different.

The bottom line being more of the same: extreme volatility in an asset class that’s not really supposed to see moves of this magnitude.
Where’s the Backstop?
Traditionally, this would be where the central bank would step in to help quell volatility.
And that’s exactly Brainard’s point. One doubts if she envisioned such a necessity barely 3 months later, however.
Ironically, the Fed will already need to embark on some form of asset buying program early next year for what are essentially mechanical issues relating to the plumbing of the rates market. One might add QE to the list as well if dramatic rate cuts aren’t enough.
This is a third reason.
Three months ago, I doubt the Fed pictured themselves digging into the Bank of Japan’s bag of tricks. Now, they might have to do just that.
Disclosure/Disclaimers:
This material may contain indicative terms only, including but not limited to pricing levels. There is no representation that any transaction can or could have been effected at such terms or prices. Proposed terms and conditions are for discussion purposes only. Finalized terms and conditions are subject to further discussion and negotiation. OTC Derivatives Risk Disclosures: To understand clearly the terms and conditions of any OTC derivative transaction you may enter into, you should carefully review the terms of trade with your counterparty, including any related schedules, credit support documents, addenda and exhibits.
You should not enter into OTC derivative transactions unless you understand the terms of the transaction you are entering into as well as the nature and extent of your risk exposure. You should also be satisfied that the OTC derivative transaction is appropriate for you in light of your circumstances and financial condition. In addition, you may be requested to post margin or collateral to support written OTC derivatives at levels consistent with the internal policies of your respective counterparty. I may have positions in assets mentioned above. In addition, I may change those positions – and frequently do.
This post was written by me, the material is my own (except where sourced), and it expresses my own opinions. I am not receiving compensation for it & have no business relationship with any of the companies and/or organizations whose assets may be mentioned in this post.
[1] By the way, between her speech & now, the NYFRB also fired their two top markets specialists & is now on the hunt for replacements. That’s important because, without them, the very terms which Brainard laid out above would be awfully difficult to enact (though, to be fair, the image of a 22-year old Treasury trader at a bank picking up a phone & hearing “Hi, this is John Williams.. Can I get a market..” makes for a compelling daydream).